宣和画谱 Network Visualizations
Evan Jones
UCSC - HAVC 122D
In this project, I wanted to explore analyzing data extracted from the Xuanhe catalog. I focused on 3 aspects: direct connections between artists, connections via shared location, and connections via shared subjects. I found these three to be the most interesting, because they are based on information readily available in the catalog, due to the highly regular format of the entries.
Note
Click on the images to open in a new tab, which allows zooming in.
Sections
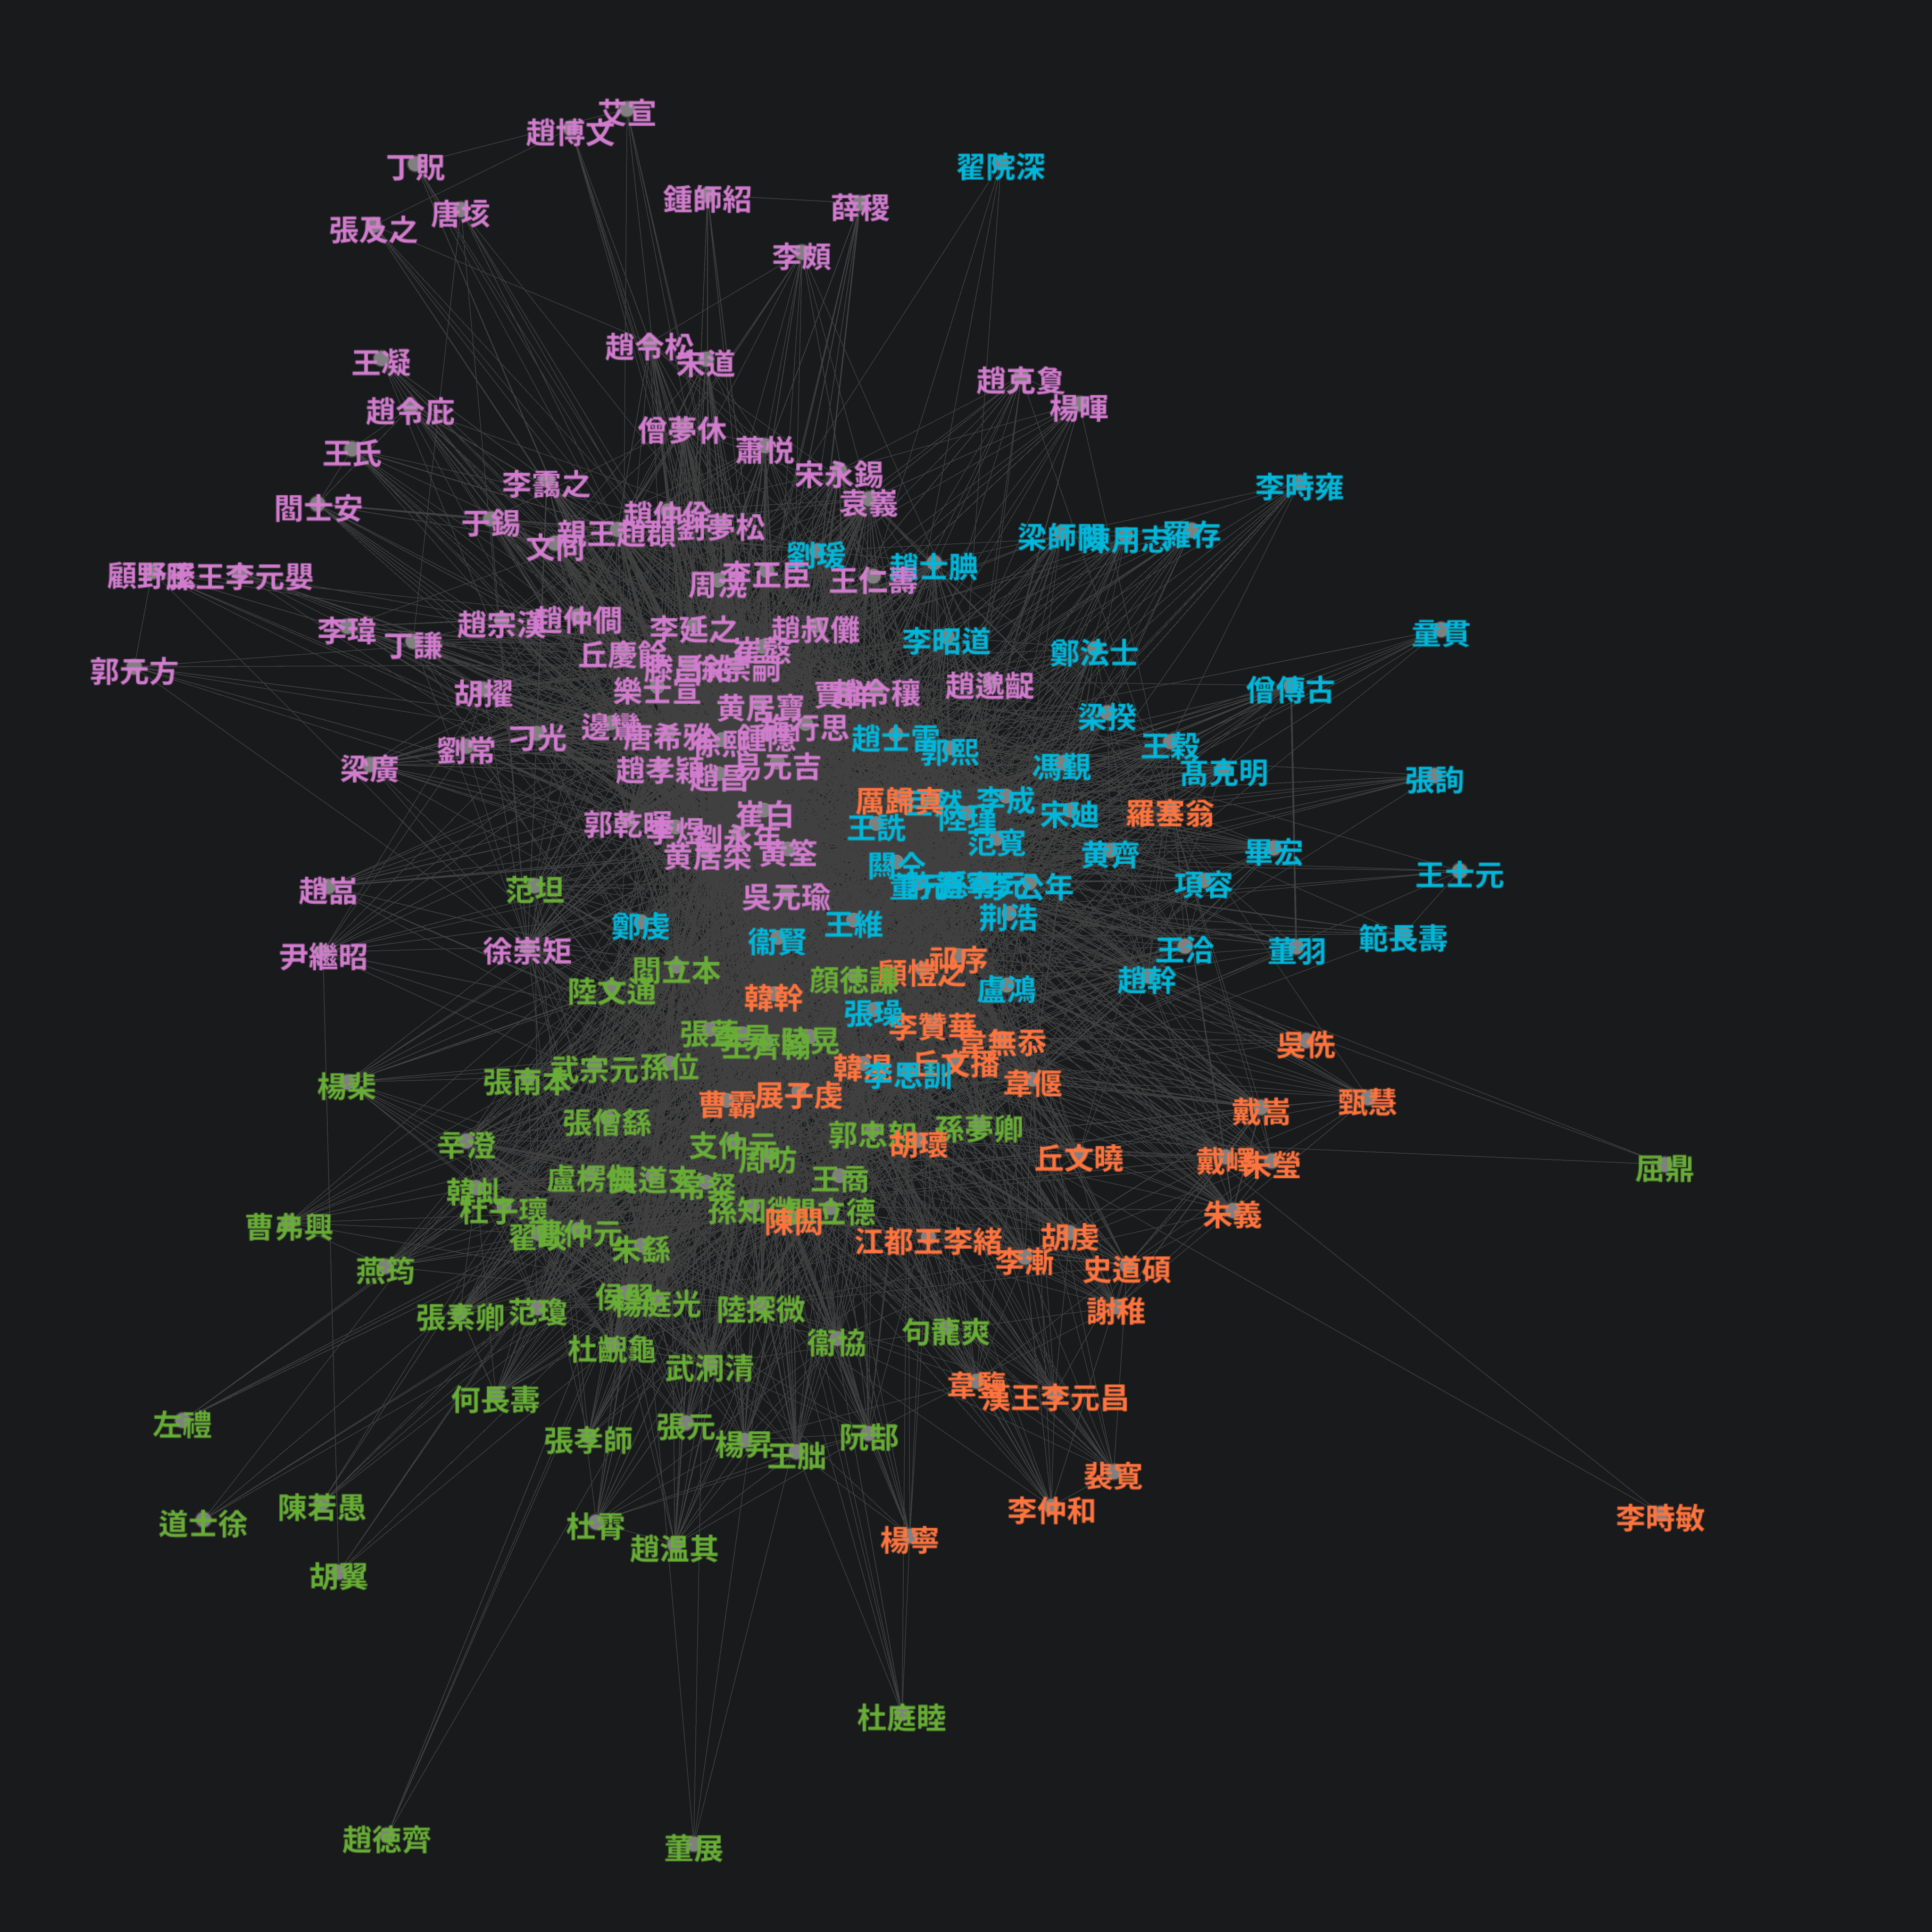
Artist References
Many entries in the catalog mention other artists, either as teachers, students, or just contemporaries. You can think about this as a directed graph, where each artist is a node and the edges are mentions referencing another artist.
The nodes can be found with simply the names of all artists. Then, the edges can be determined by searching the text of each artists entry for the names of all other artists.
I then imported the graph data into Gephi, a FOSS network visualization tool, and ran the Page Rank algorithm, which is a decent proxy for how influential one of the nodes is. Influence is determined by how many references other nodes make to it, weighted by the influence of the referring node. The size of the node label is proportional to the page rank.
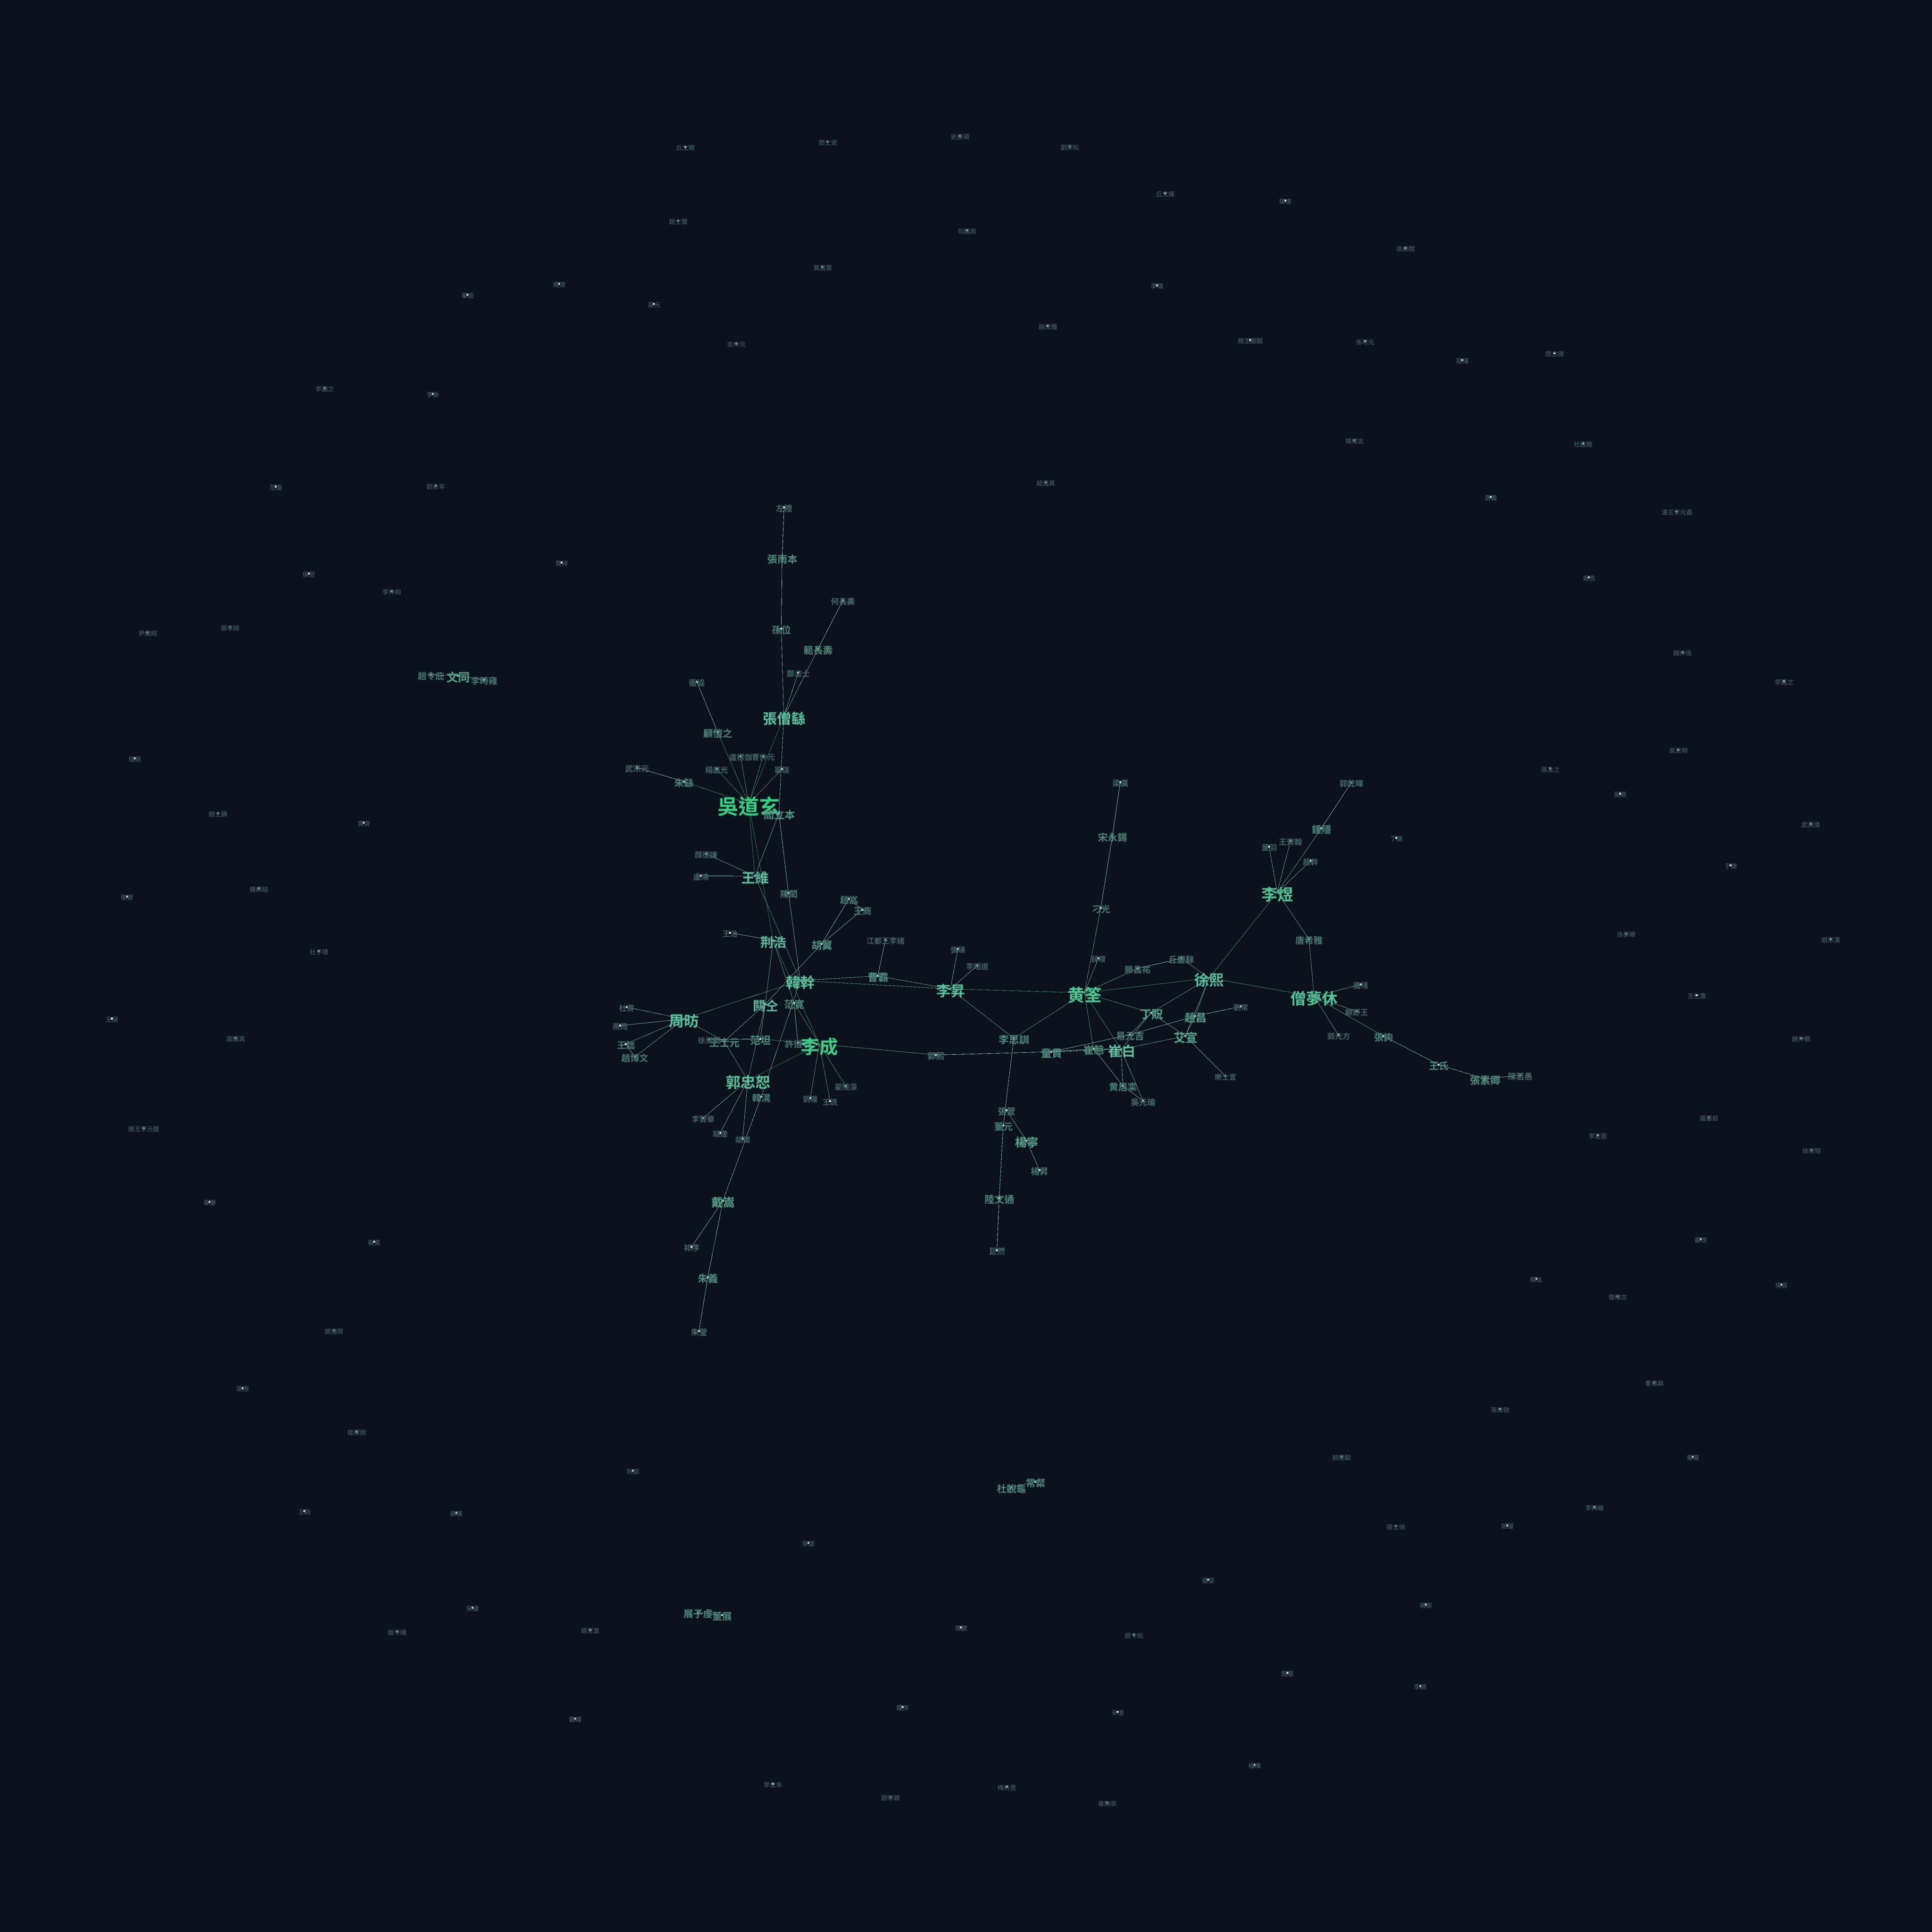
The visual interpretation is that nodes close to each other are more connected through references, and distant nodes only connect to each other through a chain of references.
The artists around the perimeter are completely unconnected: no other artist mentions them, and their entries don't mention any other artist. There are also a few islands of interconnected artists, which are not reachable from the main graph.
The node sizes also tell us that in the catalog, 吴道玄 is considered (implicitly via mentions in other entries) the most influential artist, which is interesting considering in contemporary times other artists may be considered more influential.
Artist Locations
One of the first things I noticed about the catalog is that the entries are very regular, most following a general pattern. Man entries start like the following:
張僧繇,吳人也,天監中歴官至右將軍,吳興太守,以丹青馳譽於時。
The information of interest is that the location of the artist is mentioned close to the start of the entry, and that most entries follow the pattern "<地方>人也" or "<地方>人", or if unknown, "不知何許人". This made it easy to extract potential location names with a simple regular expression.
I then manually removed a few bogus entries and put the list of historical location names into Deepseek and asked for the modern names. I found that the way to get the best results was to format the list of old names as a CSV (comma separated values, a text representation of a spreadsheet), and ask it to add another column for the modern names, or "未知" if it doesn't know. After manually spot checking a few, I decided it to trust the results and use them as is.
To create a visualization of the locations, I needed actual coordinates, for which I used the OpenStreetMap API, which is free to use but rate limited. Many queries return multiple potential locations, and the data returned by the API is sorted by a metric they call "importance", so I just took the first result for each query.
Out of all the entries in the catalog, about 3/4 of the entries actually had locations listed, and only about 2/3 of the total entries could be identified and geocoded.
The top 8 locations are as follows:
| place_name | artist_count | |
|---|---|---|
| 0 | 西安市 | 14 |
| 1 | 成都市 | 12 |
| 2 | 江南 | 10 |
| 3 | 北京市 | 7 |
| 4 | 南京市 | 6 |
| 5 | 苏州市 | 5 |
| 6 | 开封市 | 5 |
| 7 | 洛阳市 | 4 |
This is the heatmap of artist locations I was able to produce:
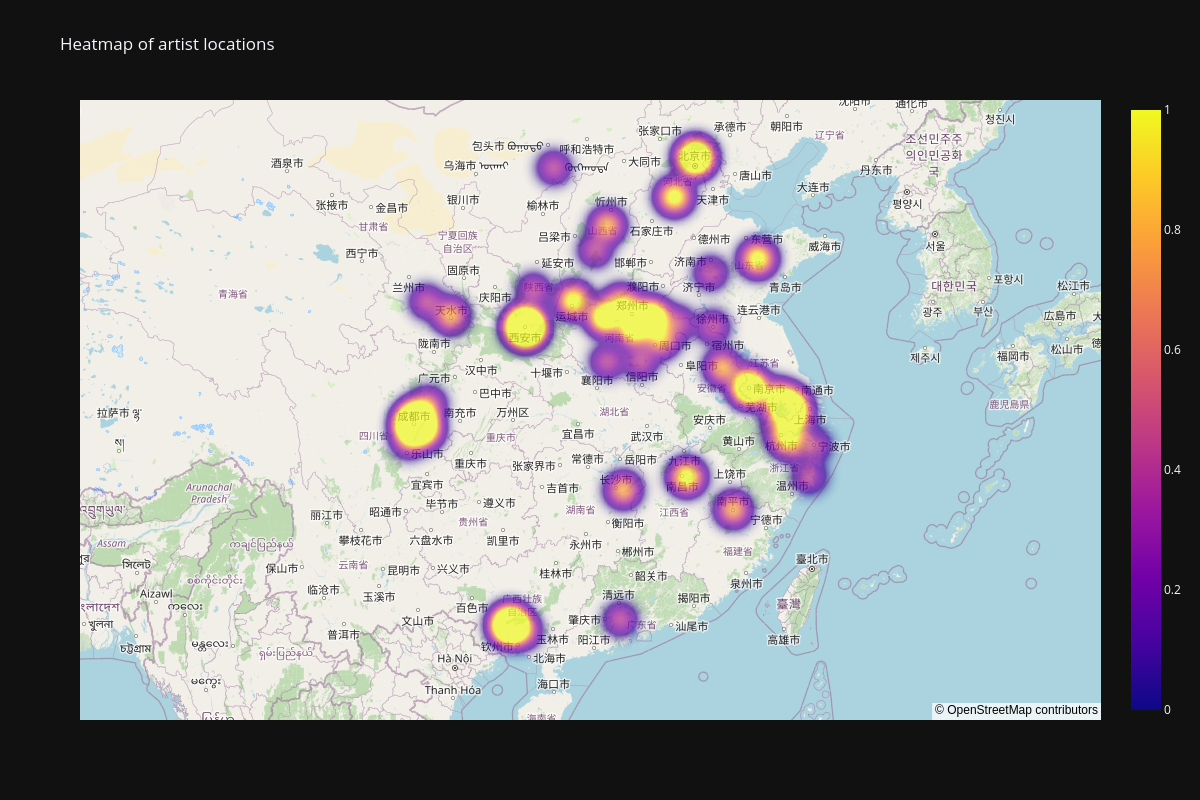
The results mirror similar studies of Tang Dynasty population, such this study of biographies in the Hartwell database.
Shared Subjects
Each entry in the catalog has a list of paintings, which is in a highly regular format. As an example, the entry for 吳道玄 has the following list at the end:
天尊像一。木紋天尊像一,列聖朝元圖一,佛會圖一,熾盛光佛像一,阿彌陁佛像一,三方如來像一,毗盧遮那佛像一,維摩像二,孔雀明王像四,寳檀花菩薩像一,觀音菩薩像二,思維菩薩像一,寳印菩薩像一,慈氏菩薩像一,大悲菩薩像三,等覺菩薩像一,如意菩薩像一,二菩薩像一,菩薩像一,地藏像一,帝釋像二,太陽帝君像一,辰星像一,太白像一,熒惑像一,羅㬋像二,計都像一,五星像五,五星圖一,二十八宿像一,托塔天王圖一,護法天王像二,行道天王像一,雲蓋天王像一,毗沙門天王像一,請塔天王像一,天王像五,神王像二,大護法神十四,善神像九六甲神像一,天龍神將像一,摩那龍王像一,和修吉龍王像一,温鉢羅龍王像一,跋難陀龍王像一,徳义伽龍王像一,檀相手印圖二,雙林圖一,南方寳生如來像一,北方妙聲如來像一。
All entries follow the format of "(painting type)(number)", so I was able to extract the list of paintings for each artist with regular expressions.
The top 20 most common subjects are as follows, out of over 2500 unique subjects:
| subject | count |
|---|---|
| 羅漢像 | 118 |
| 牧牛圖 | 58 |
| 墨竹圖 | 49 |
| 十六大阿羅漢像 | 48 |
| 十六羅漢圖 | 48 |
| 秋山圖 | 41 |
| 夏山圖 | 34 |
| 大阿羅漢 | 32 |
| 牡丹圖 | 28 |
| 天地水三官像 | 24 |
| 十六羅漢像 | 23 |
| 牡丹鵓鴿圖 | 23 |
| 牧馬圖 | 22 |
| 乳牛圖 | 22 |
| 遊魚圖 | 20 |
| 春山圖 | 20 |
| 寫生折枝花圖 | 20 |
| 折枝花圖 | 17 |
| 鷄鷹圖 | 17 |
| 寒林圖 | 17 |
To turn this dataset into a graph, I interpreted 2 artists sharing a subject as a connection between them. Then the weight of the edge is the number of shared subjects. Unlike the previous graph with the mentions relation, this graph is undirected.
Following a similar procedure, I imported the graph data into Gephi, and ran the modularity metric, which is a method of community detection.
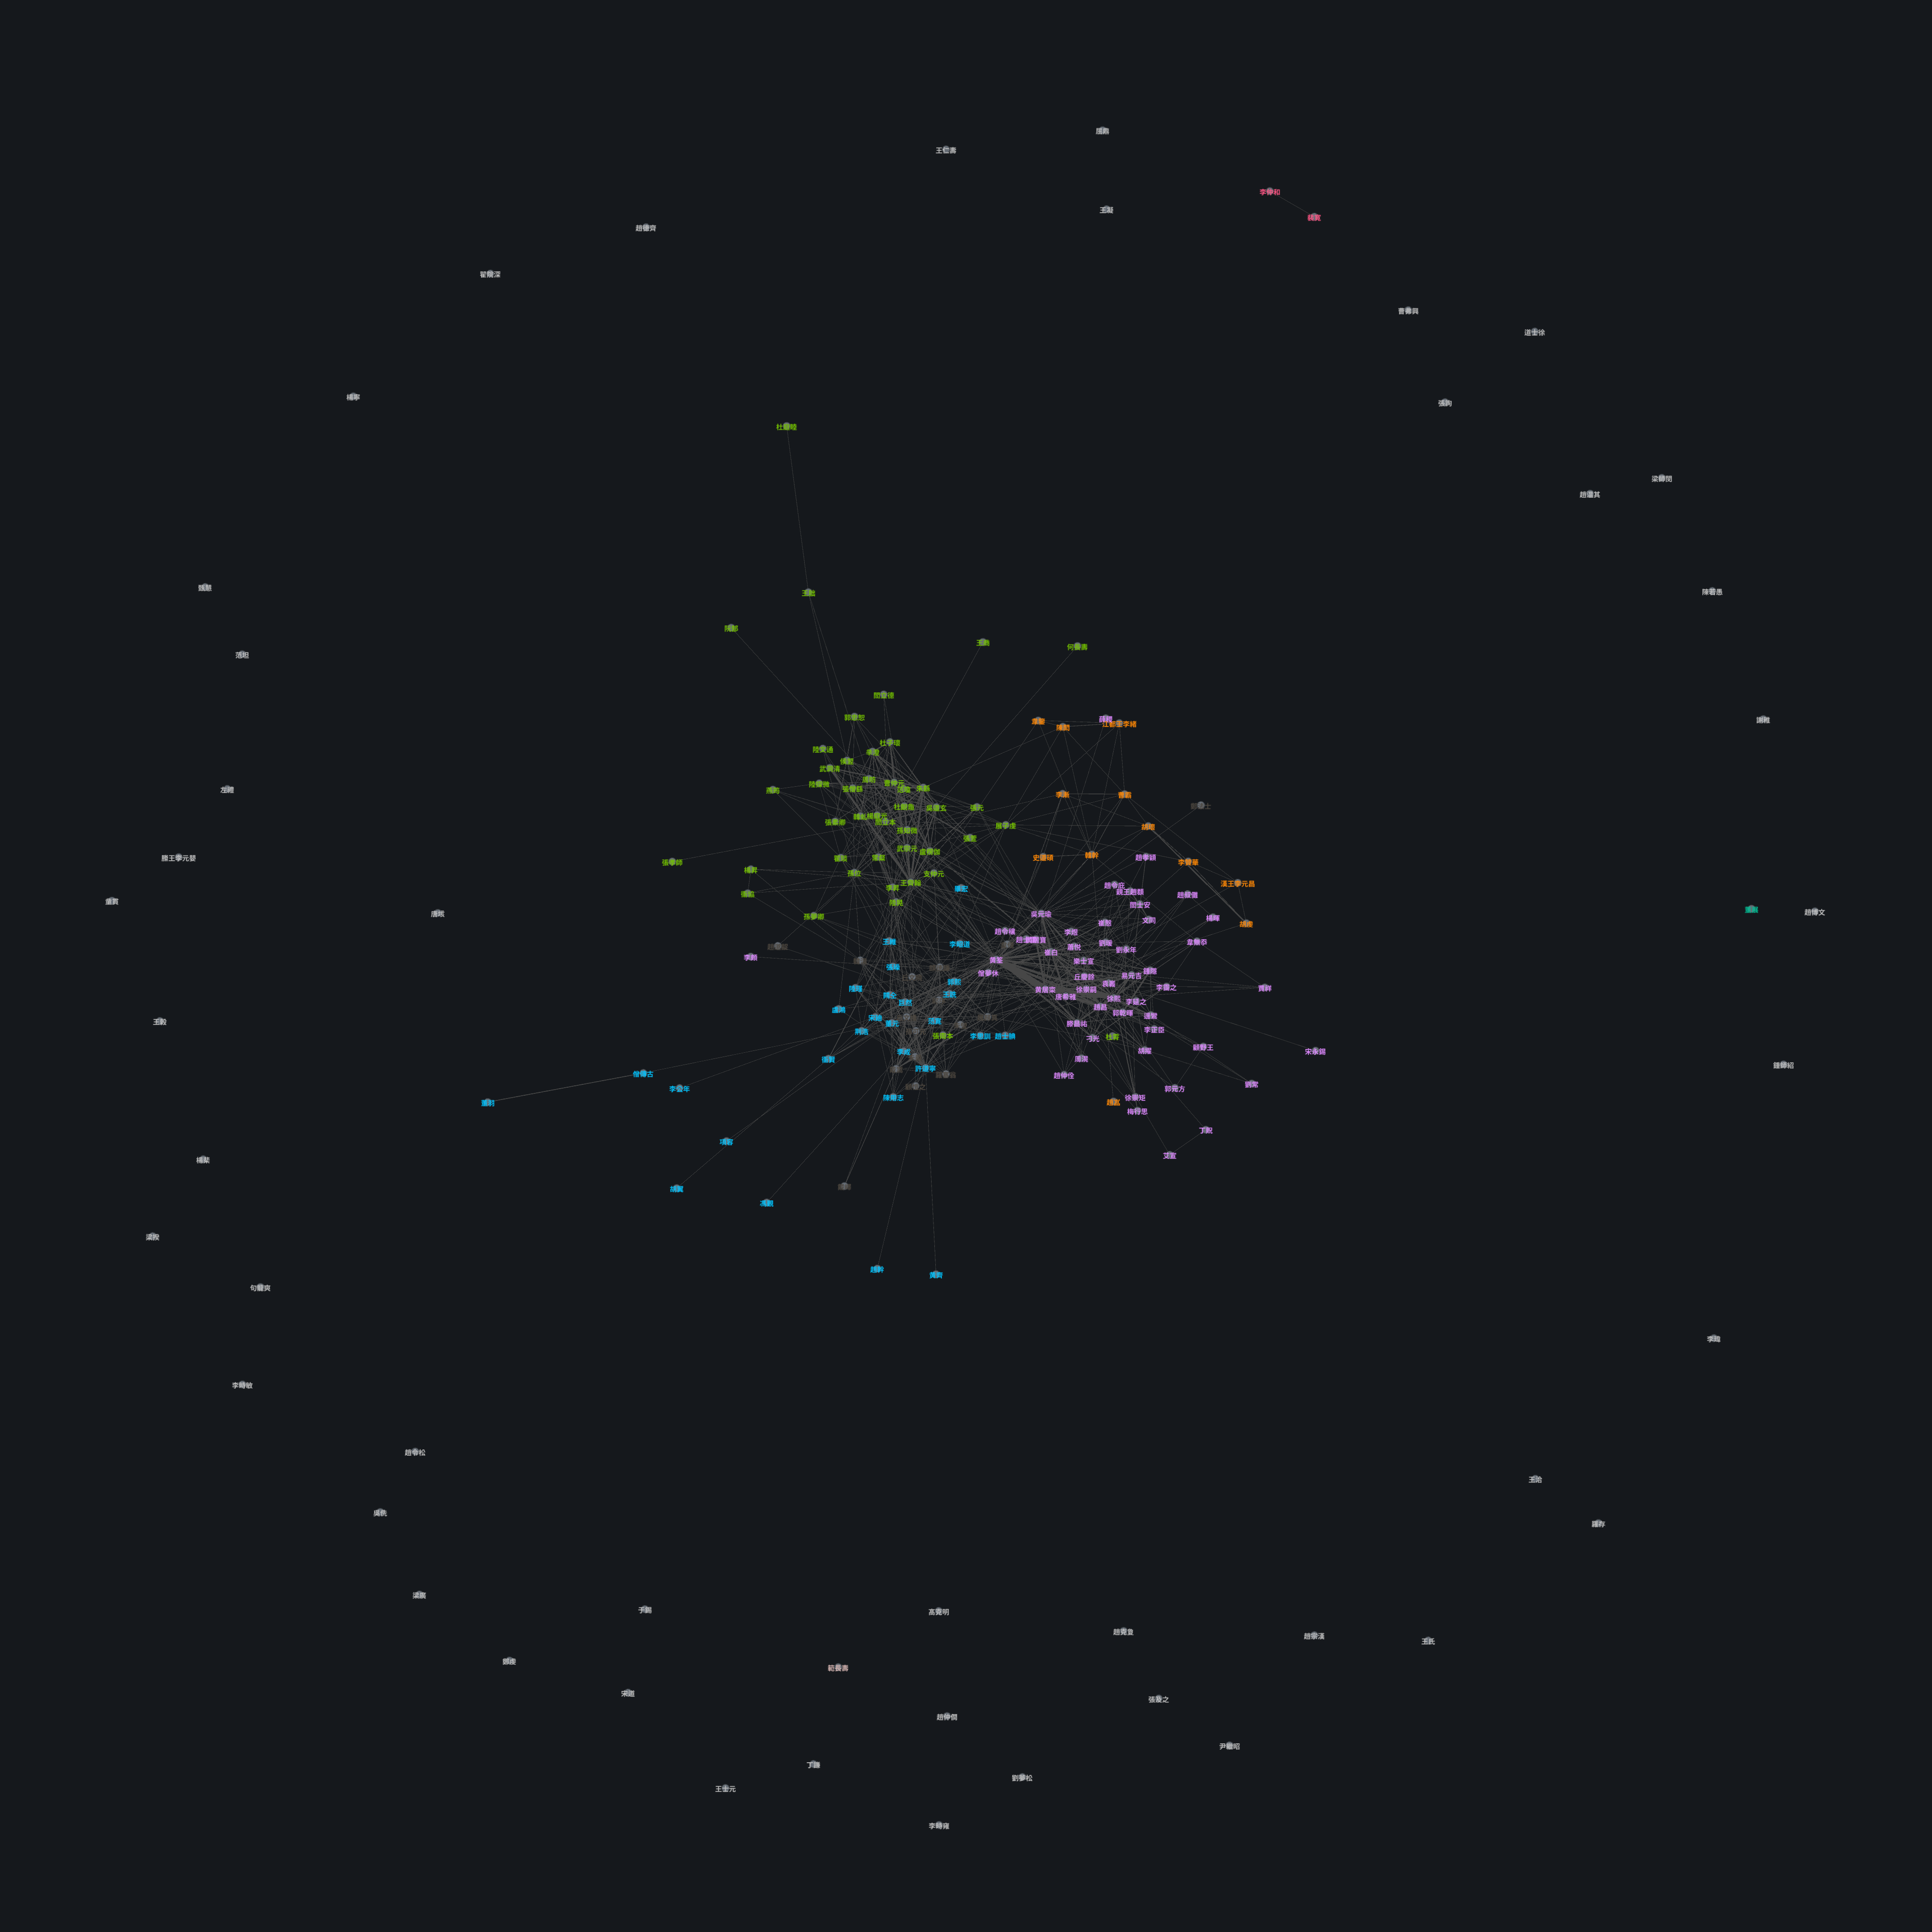
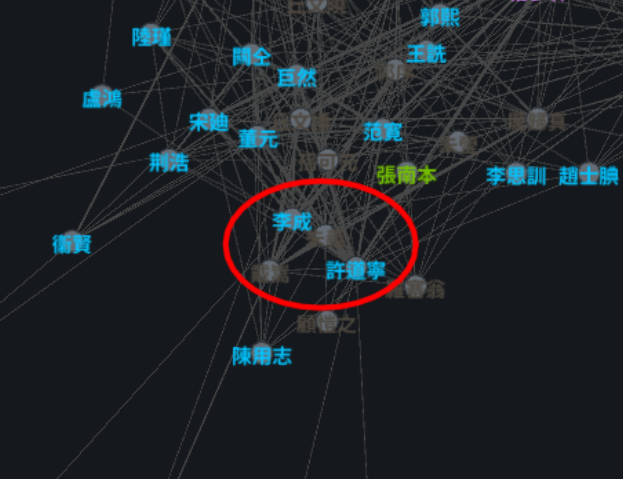
To interpret this visually, we should expect to see artists which painted similar subjects to be in close proximity to each other, and in the same community. For example, Xu Daoning's Chinese Wikipedia page mentions relations to Li Cheng's style and subject matter, and indeed they appear in the same community, and close to each other.
Further exploration with grouping subjects
One potential issue I identified with the previous visualization is that the subjects are too granular. Take this example, which is a snippet from the listing for Xu Daoning:
秋江早行圖一,嵐鎖秋峰圖三,雪霽行舟圖三,雪峰僧舎圖一,雪滿羣峰圖三,雪滿危峰圖三,羣峰密雪圖三,羣山密雪圖一,雪江漁釣圖二
These are all highly specific descriptions of the paintings, much more granular than some other descriptions present in the catalog, such as: "牛圖", or "秋山圖".
To group the subjects, I experimented with using sentence embeddings, which are a way to represent a sentence as a fixed size vector, where 2 vectors are supposed to have the property that if they are similar, then the sentences are similar in meaning. To do this I used the BAAI/bge-large-zh-v1.5 model from HuggingFace.
I then used k-means clustering to group the descriptions into 256 clusters, down from over 2500 unique descriptions.
Following the same procedure as before, I produced the following visualization:
Sources/datasets used
- 宣和画谱 original text exported as htmlz
- OpenStreetMap API for geocoding location names